DIMO Insights #1 - How real is range anxiety?
Introduction
We're using DIMO data to explore how EV driver behavior compares to ICE (gas/diesel). There are some surprising results.
As more EVs come to market, “range anxiety” remains a focal point in industry and consumer conversations. The idea that drivers shun EVs for fear of their shorter range vs ICE cars is well documented in surveys, but there is not much data available about the real world behavior of EV drivers.
We're using aggregated DIMO data to see how far drivers typically venture from their anchor (read: home or office) locations. Does range anxiety show up in the driving behavior of EV owners?
What we find is that EV drivers on DIMO stick to an anchor location less than ICE drivers — taking longer trips and rarely experiencing low charge.
Read to the end for some bonus content on how gas prices impact ICE driver behavior too!
Today, our data is limited to a subset of EV owners (Tesla drivers make up 95%+ of the EVs on DIMO), but we will continue to build out this analysis further as more cars are added.

Why does this matter for DIMO Users?
DIMO users with ICE vehicles will also be able to benefit from this research by accessing an “EV suitability score” that shows them how easily they could swap into an EV from their gas car without changing their behavior.
We will share some data here and dive deeper into this score in our next blog post.... Ok Let's Get Started:
Driving sessions in EVs vs. ICE vehicles
For the purposes of this post, we're looking at what we’ve decided to call a 'driving session.' This could be someone going to and from work (two trips) or someone driving all over town for errands (a series of trips), but what makes it different from a one way trip is the vehicle returning to its “anchor location” for at least four hours.
This provides us an "anchor" location we can use when considering a driver's range anxiety, as most EV owners have access to a home or office charger.
When a vehicle ends a trip at the anchor location and the next trip starts at least four hours later, that time will be considered plausible for charging (around 200 kilometers for a Level 2 charger). Every time the vehicle is stopped at the anchor location for at least four hours, a new “session” will begin upon the next movement.


Driving session data from a DIMO test vehicle shown for illustrative purposes - color coded to show state of charge (left) and distance from anchor location (right)


Analysis is conducted on aggregated & anonymized data.
If range anxiety were real, we would expect drivers with EVs to take shorter sessions, being mindful to return to a charger before they run too low. Similarly, we would expect ICE drivers to have longer driving sessions, since the ubiquity of gas stations and longer vehicle ranges would allay any concerns about ending up stranded.
Below we look at about 100,000 sessions across 1,200 EVs and 30,000 sessions across 750 ICE vehicles.

In the graph above, we show the percentage of total driving sessions of different lengths. For example, the orange bar on the far left shows how just over 25% of all ICE vehicle driving sessions are just 10 km or less.
What is interesting is ICE vehicles are more commonly used for the sessions on the shortest end of the axis (30 km or less) while EVs are more commonly racking up longer driving sessions. If we look out to 100 km, we see we’re covering the vast majority of sessions for both ICE and EVs, but on the whole it’s significantly more common for an ICE vehicle driving session to be under this threshold: 85% of all ICE vehicle sessions are under 100 km compared to 77% of EV sessions.
This goes against expectations where we are conditioned to think about EVs as the ideal format for quick, short trips specifically due to range concerns.
But that’s not the whole story. The graph above only goes out to about 250 km of session lengths. What if we look at even longer lengths?

One important milestone is a 200 km driving session - this distance at which an EV driver would likely run out of fuel after a 4 hour period charging at an anchor location. Because of the importance of this distance, behavior at or beyond this point could be telling.
One thing we find is that about 25% of ICE vehicle drivers never have a session more than 200 kilometers. These drivers would never run out of charge with a home Level 2 charger (because they would be fully charged after 4 hours at home). Interestingly, the number is lower for EV drivers: about 16% never drive this distance in a session. The milestone that we would expect to be a barrier for EV drivers seems to be nothing of the sort — more EV drivers seem to cross this threshold than ICE drivers. So much for the ease and convenience of gas stations vs chargers.
What about even longer road trips? If we double it to 400 km, about 46% of all ICE vehicles and 36% of EVs never have a session of this length. The pattern holds: despite expecting EV drivers to shy away from these distances, they embrace them even more than ICE drivers in our dataset.
This demonstrates that these Tesla drivers are not driving as if they are more constrained by EV disbelievers’ fears about range anxiety. Actually, they are generally driving further from anchor than these ICE drivers! In the future we’ll be able to layer in more data from non-Tesla EVs as well as fast-charging networks in order to determine the impact of charging infrastructure on driver behavior.
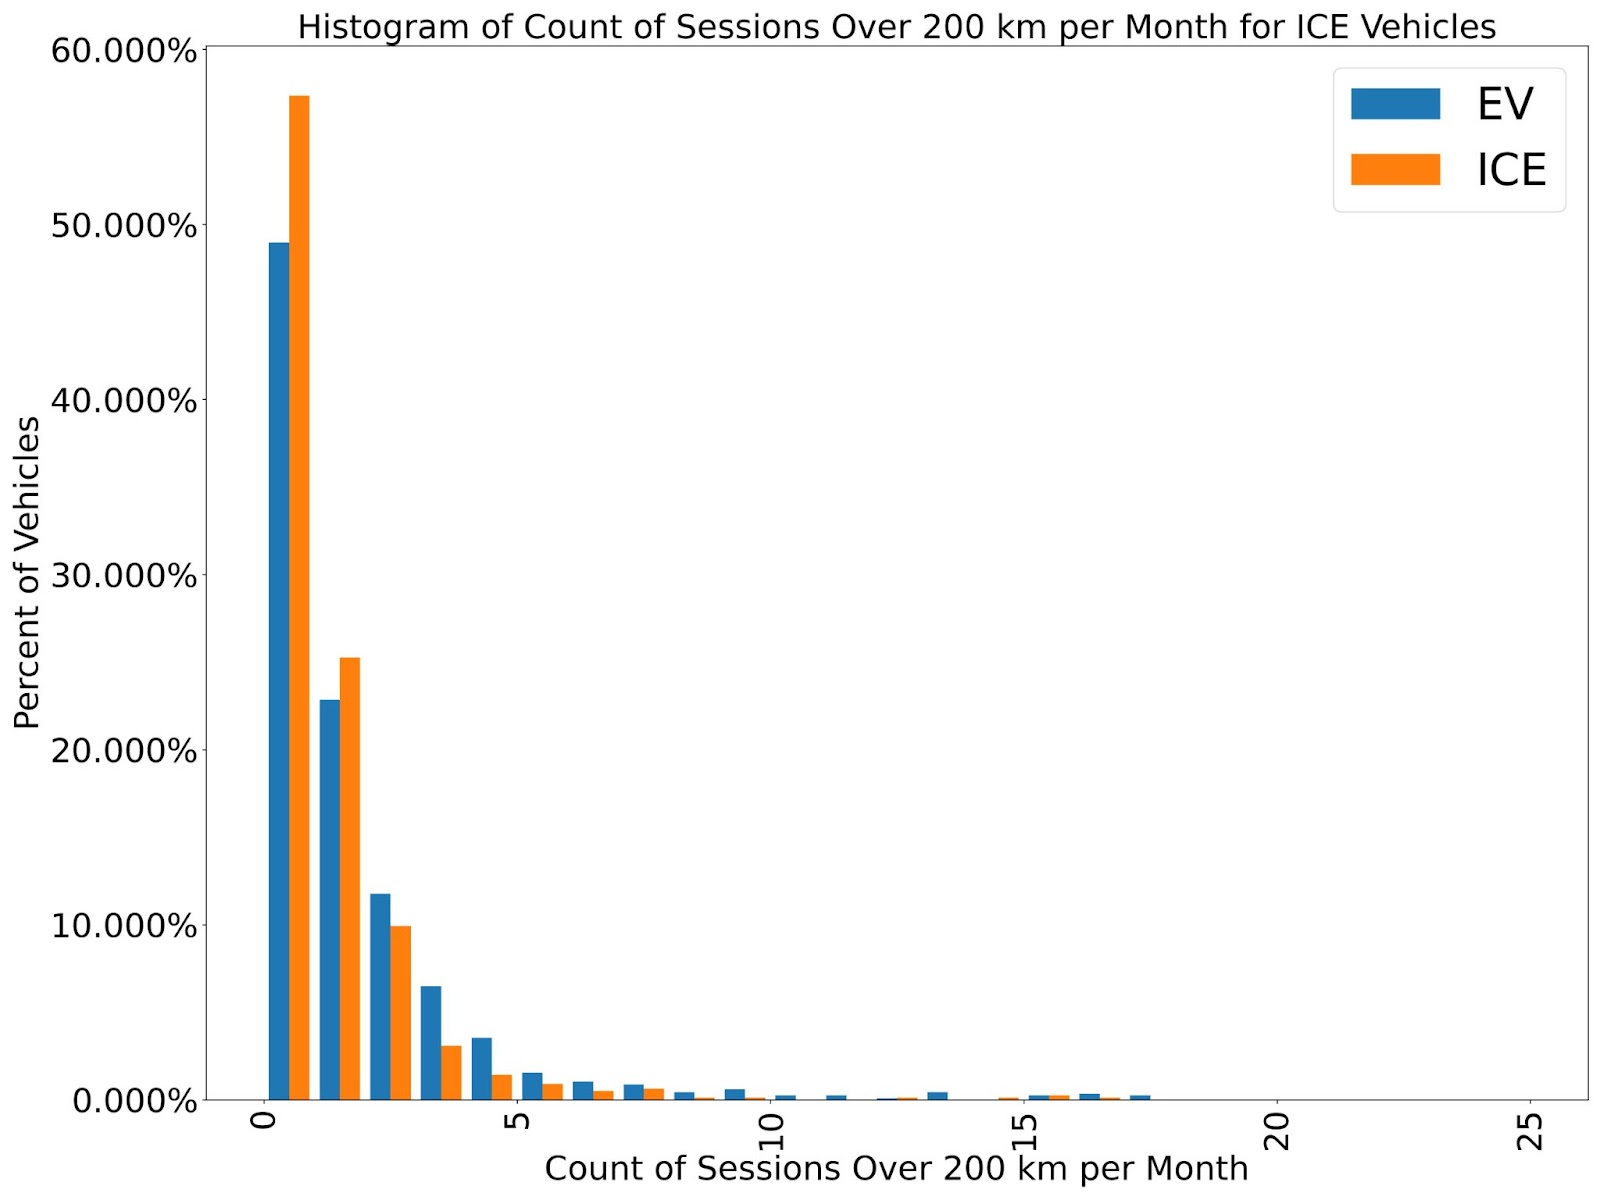
Further, let’s look at how frequently drivers have sessions over 200 kilometers per month: about half of all drivers have one or fewer sessions over 200 kilometers per month. And 82% of drivers have 1 or fewer sessions over 400 kilometers per month.
We also wanted to look at the longer end of sessions per vehicle and by vehicle type, and to avoid looking at extremes, we decided to examine the second longest session. In the graph below, we can clearly see the behavior of EV drivers tending to have longer sessions than ICE drivers.

Now let’s explore this data from one other angle: how much fuel/charge do drivers typically have in their vehicle.
The graph below can tell us what percentage of miles are driven below a given state of charge - key for determining both battery health scores and range anxiety.
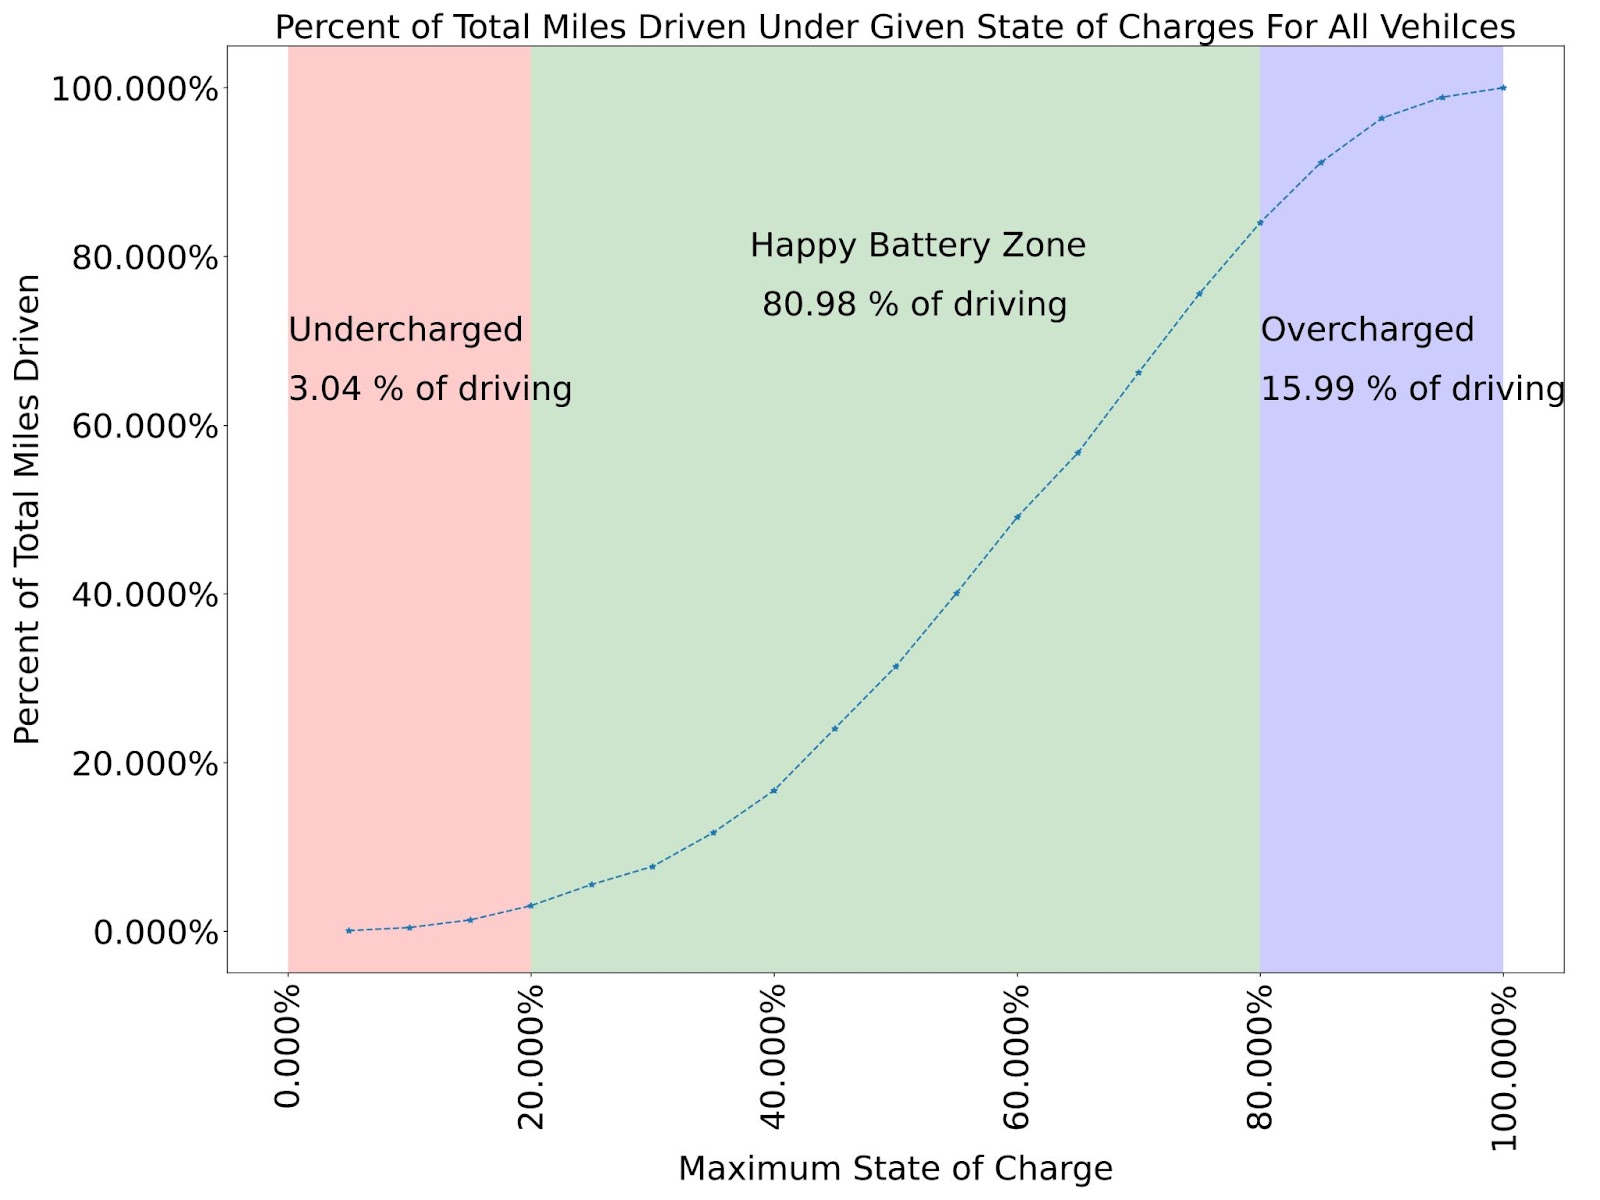
Aggregated battery data from every EV on DIMO
For example, in 10 million miles driven by DIMO EV drivers only about 3% take place in the “Range Anxiety Zone” when the vehicle is under 20% state of charge! EV drivers are so good at avoiding driving on low percentages of charge that they actually drive under 50% charge for less than a third of the time (31%).
Many EV owners never experience range anxiety-
Here's one user from the test fleet who charges to 100% each day, and has never experienced under 50% charge over thousands of miles of driving.

ICE Vehicles Experience a Different Kind of Anxiety:
When you overlay gas prices from the same time period, it’s clear that ICE drivers (the blue area above) experience a different kind of “Fuel Anxiety” - when gas prices go up they keep up to 20% less fuel in their tank - going from a high of 65% to a low of 44% when gas prices peaked in the US in June/July of 2022!


In DIMO data the results are pretty clear: EV drivers don’t seem to experience range anxiety very frequently, and their aggregate behavior is less impacted by external factors than ICE drivers, who significantly alter behavior due to gas prices.
Why does this matter for DIMO users?
In the DIMO app, users will be able to analyze their driving with an ICE vehicle automatically and see how easy it would be to switch to electric! In our next post, we’ll dive into the creation of this EV-conversion score, as well as other metrics like battery and charging health.
For an individual with a high EV-conversion score, they’ll confidently be able to make the switch! We can even show them how much they’ll save over a typical year based on their existing driving patterns and local electricity rates.
When the time to make a change comes, there are other DIMO partners ready to help them with everything from vehicle purchase, tax credits and incentives, financing, and of course keeping their new EV investment properly maintained over time.
What is DIMO Insights?
The DIMO Insights team is made up of experts in data engineering, data science, and mobility. They have access to telematics data from vehicles on the network, and are tasked with turning it into useful and valuable information that can directly benefit DIMO users, the traveling public, and the environment.
Analysis in this report was conducted by Jeremy Lerner - a Senior Data Scientist contributing to DIMO. Jeremy helped design Ford's BlueCruise and has published several papers on how to utilize connected vehicle data to understand drivers. Data-driven simulations are Jeremy's natural playground.
Do you have feedback or an idea for a future Insights post?
We want to hear from you!
Email [email protected] or tweet @dimo_network to let us know what you think.
If you’re a company looking for connected vehicle insights you can buy a license to access aggregated data from DIMO users or hire the Insights Team directly to crunch numbers for you!
The DIMO Insights team is made up of experts in data engineering, data science, and mobility. They have access to telematics data from vehicles on the network, and are tasked with turning it into useful and valuable information that can directly benefit DIMO users, the traveling public, and the environment.
Analysis is led by Jeremy Lerner - a Senior Data Scientist contributing to DIMO. Jeremy helped design Ford's BlueCruise and has published several papers on how to utilize connected vehicle data to understand drivers. Data-driven simulations are Jeremy's natural playground.